J2EE Web Application Performance – Concepts & Overview
Introduction
Over the last 7+ years I have worked on over a dozen J2EE based Web applications. The most common and recurring problem across all these projects was the "performance problem". Some of these Web applications once put in production system or in UAT (User Acceptance Testing) displayed poor performance. This caused last minute panic and emergency performance tuning. In some cases it saved projects, but at a huge cost.
The most common performance problem was the unacceptable response time when the user load on the system is increased. In some cases there was a continuous memory leak somewhere in the application which caused a server crash after few days of system uptime. There were even cases where the system crawled to a halt when it is put in production with a single user! The production data volume was too much for the Web application.
Performance considerations in a J2EE application should never be an afterthought. It is very important to do "Performance Management" throughout the J2EE application cycle. Every piece of the application must be tested for acceptable performance and it should be repeated for the real production user load. But "Performance Management" requires a higher view of the overall application being built and performance tuning requires a sufficient expertise in the area you are trying to tune.
In this article, I will give an overview of J2EE Web application performance considerations, issues and tools/processes to address them. I may later expand individual sections into detailed articles.
What is the cost of Web application performance problems?
Poor performance of a Web application will have a very bad impact on all the stakeholders of the application. It will cause loss of revenue for the business owner since customers expect a fast online system. If the performance of an online retail shop is poor, people will move on to another site and it can mean huge losses for the retailer. For example, even an hour of downtime can cause hundreds of thousands of dollars in lost revenue for Amazon.
As far as the Application provider is concerned, a poor performing application means loss of customer confidence. There may be SLAs (Service Level Agreements) associated with application performance and non compliance may mean huge penalties.
 A slow performing application can also cause loss of productivity. It can lead to employee dissatisfaction which again impacts efficiency of an organization. For example, in a call Centre productivity may be measured as the number of calls taken. Now if the application that the call Centre guy uses performs badly, it can cause calls getting delayed, impatient callers and finally complete breakdown of the call Centre itself.
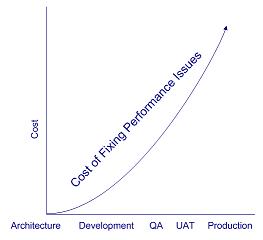
It is very important to incorporate performance consideration in the early stages of the project. It needs to be considered even during requirements analysis. It is also very important during architecture and design of the Web application. The diagram on the right shows the cost of fixing a performance issue at various stages of application development cycle. As you can see fixing a performance issue in production can be a very costly affair.
 Why J2EE performance issues tend to be complex?
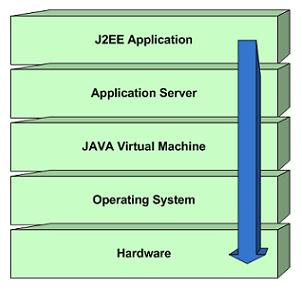
J2EE applications are complex and it is built on a layered architecture (see figure). The problems can happen at any point on this stack. Typically problems are found in J2EE application itself. Typically a J2EE application is composed of a large number of components such as JSPs, servlets, EJBs, database drivers, web services, frameworks, third party components and so on.
But configuration parameters at the application server can also affect application performance. For example, request thread pool or database connection pool are configured on the J2EE application server and incorrect configuration can lead to performance problems. Similarly memory heap settings in JVM can have a big impact on the performance. The operating system parameters (swap space, threads) and hardware configuration (free RAM) etc. can affect application performance.
This is what makes J2EE performance issues so complex. There are so many parameters and so many failure points that it is difficult to consider them all at the same time. All the stack layers except J2EE application can be easily fine tuned. But when it comes to the application, substantial changes in design or code may be required to improve performance.
How to define Web application performance?
Different stakeholders have different views of Web application performance. As a database administrator, you may be concerned with performance of SQL queries. As a technical architect I am more worried about the response time and application throughput including bottlenecks that may hinder application scalability.
For J2EE based Web applications, the following are main metrics we are typically concerned about.
1. Response Time – This is the single most important metric for Web application performance. The success or failure of a Web application is dependent on this parameter. Typically use case SLAs define the response time in the range of 1-5 seconds.
2. Resource Utilization – Resource utilization is another important parameter that affects application performance. In the case of a Web application, resources include JVM memory, connection/thread pool, CPU time etc. Vertical scalability of an application depends on how efficiently resources are utilized. For example, assume that there is a design flaw in the application which doesn’t free up unused connections back to connection pool. Eventually connection pool will run out of free connections and the system will fail.
3. Request Throughput – This defines the amount of work that gets done in a fixed timeframe. It is also an indicator of application efficiency. A high throughput means that a single server can process a large number of requests with minimal impact on response time. Request throughput is affected by efficiency of SQL queries and how components are designed in the application.
How to capture Web application performance metrics?
In order to measure application performance, we need to collect performance metrics. Then we need to aggregate the data and then interpret the data. How do we capture various Web application metrics?
Performance metrics can be captured from the application server using standard JMX based metrics API. Some of the application servers have proprietary API to capture performance metrics.
Another way to capture performance metrics is to use code instrumentation or code profiling. There are advanced profiling tools such JProbe and JProfiler which uses bytecode based code instrumentation for collecting application metrics. These tools are capable of a wide range of execution statistics and memory statistics with minimal variance on the application performance.
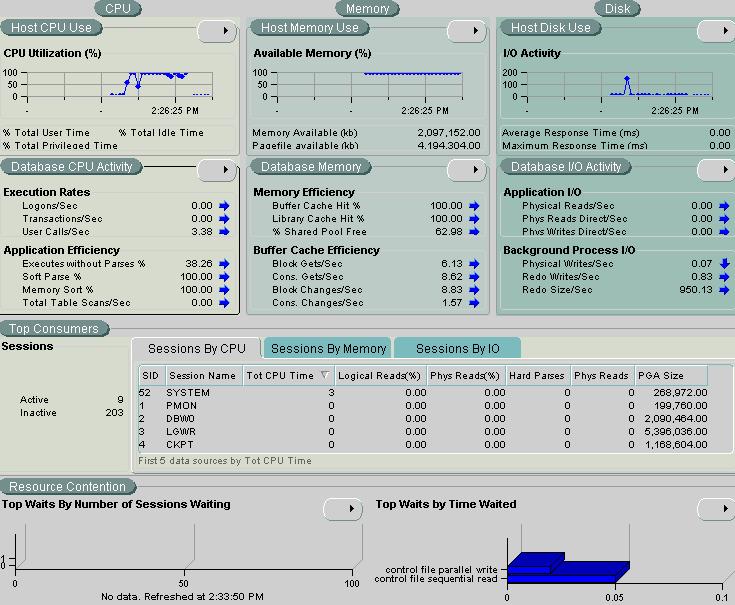
It is also possible to capture performance metrics directly from the operating system or from the database server. Following is a snapshot of the performance overview given by Oracle Performance Manager tool. This is called "database health overview". This is a very good way to monitor database query efficiency.
There is another report in Oracle Performance Manager called "Top SQL report". This can give you the top 25 SQL queries which is taking the most CPU time, most disk access etc. It is always a good way to find queries that requires tuning.

What are the tools available for performance testing and metrics capture?
There are a number of tools available for performance testing and for capturing performance metrics. In this section, I will briefly cover them.
1. Performance testing tools – Microsoft Web Application Stress Tool and OpenSTA are two free performance testing tools I am very familiar with. There is no scripting available in Microsoft tool and hence it is suitable only if you are stress testing reports or read only screens. OpenSTA supports all advanced features such as scripting and performance metrics collection from remote servers.
Other performance testing tools that are commonly used are LoadRunner, WebLOAD and Borland’s SilkPerformer.
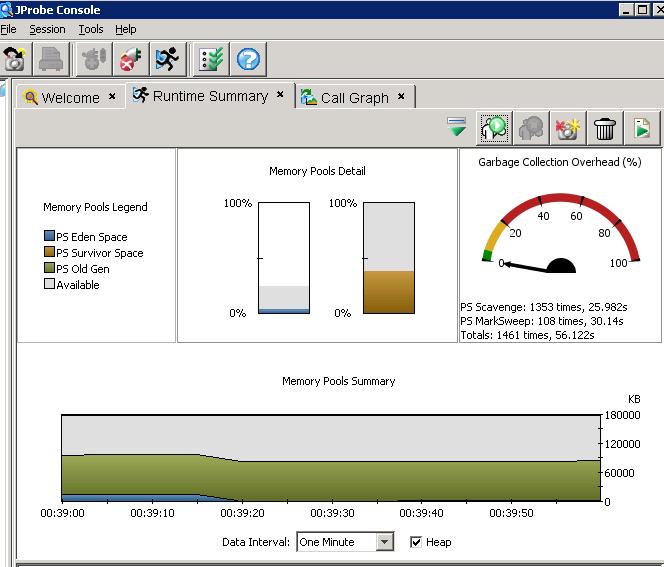
2. Code profiling tools – Jprobe and JProfiler are some of the profiling tools that can be used for code profiling and memory monitoring. These tools use a custom Classloader to change bytecodes on the fly to add profiling code at runtime. Following screen shot shows memory monitoring of JProbe in action.

JProbe is a powerful tool to find performance bottlenecks in a Java application. It can also be easily integrated with application servers such as Tomcat and JBoss for metrics capture. It can also capture method statistics such as number of calls, average call time and cumulative call time. It can also trace an application method call to the lower most layers.
What are the main causes of Web application performance problems?
Performance problems can be caused at any layer of a J2EE Web application. Typically problems at Application server, JVM and hardware can be easily fixed by configuration or by adding more hardware. But the main performance problem area is the J2EE application itself. I will give a brief overview of the major causes behind J2EE performance problems.
1. Excessive session data – This is a very common issue in Web applications. The easiest way to retain data across screens is HTTP session and new programmers abuse this functionality. Storing large data in session affects application scalability. The heap memory is exhausted even for a small number of users!
Moving the state management from server to client (using hidden fields etc.) is the best way to ensure scalability.
2. Nested SQL queries – In many development teams, SQL queries are written by Java programmers who are are not aware of the costs of nested SQL queries. Instead of writing SQL joins, they tend to call SQL statements in loops. This increases the number of distinct queries performed and substantially increases query time and database load.
3. Inefficient SQL queries – Inefficient SQL queries are a very common problem. Every J2EE project needs an SQL expert who can tune queries and who can suggest other query optimization strategies such indexing and materialized views. Sometimes you will have to do a trade off between application features and application performance.
4. Inefficient code or algorithm – Code optimization is an area where typically a lot of effort is put in without much return. Here I am with Donald Knuth,
"We should forget about small efficiencies, say about 97% of the time: premature optimization is the root of all evil. "
But there are areas such as sorting, rule evaluation etc. where code optimization is a must to ensure adequate performance under load. For example, recently I had evaluated Drools rules engine for display of context menu items and found that for large load it is an overkill.
5. Object cycling – This is a phenomenon where a large number of objects are created and discarded in a loop. When a large load is applied on this piece of code, the garbage collection becomes so frequent that it affects performance of the application. Following code illustrates this problem,
String s = String.valueOf(i);
}
The above code creates ten thousand string objects and destroys them when it is no longer needed. If the above code segment is called by large number of users, the load on the garbage collector will be very high and it will affect application performance. In order to release all the non used objects, garbage collector stops all threads and hence large number of garbage collection cycles is problematic.
Performance Management in Web application development lifecycle
It is important to bring performance considerations into every phase of J2EE application development. Let us consider some possible strategies.
1. Requirements Analysis – During requirement analysis, it is very important to capture performance based SLAs such as response time required. This can be captured per user case. It is also required to capture non functional requirements such as expected user load and projection of data volume growth.
2. Architecture & Design – This is an important phase all performance considerations should be factored in. If there is a large user base, the design should limit the data stored in session. If data is displayed in a grid and there is a lot of data in database table, we need to bring in database level pagination. Also the Web framework needs to be evaluated for target load.
3. Coding & Unit Testing – Code profiling and performance testing of individual screens should be made part of unit test cases. Code profiling can also be undertaken as part of code reviews.
4. QA & Integration Testing – QA should independently performance test the integrated code. They can use the SLAs captured during requirements as the exit criteria.
5. User Acceptable Testing (UAT) – It is very important to use production environment or an environment as near as possible to production during UAT testing. Load testing can be conducted as the exit criteria.
Summary
In many large enterprise applications the killer problem is the "performance problem". Trying to address it just before going to production is a sure recipe for disaster. The only way to ensure adequate performance of the application is to bring in "Performance Management" in every phase of a J2EE application development. SLAs (for example, response time) must be incorporated in application requirements. Code profiling should be integrated with development and unit testing. Load testing should be integrated with application integration testing and QA activities. Another round of load testing(with realistic load) on the production server configuration should be conducted before pushing the application to production.
Incorporation of good performance testing/profiling tools and practices are the only way to proactively address J2EE Web application performance problems.
August 25, 2008 | Posted in Programming No Comments » | By Jayson
